- New General Features
- More Informative ‘My Datasets‘ Page
- Updated Preview Page
- New Treemap Visualization
- Ability to Export a Labelled Dataset
- New Interface to Manage Dictionaries (Manual Categories)
- New Twitter-specific Improvements
- New Twitter Data Collection Modes in Netlytic: “Recent tweets” and “Live tweets” modes.
- Twitter Data Collection: “Recent tweets” Mode
- Twitter Data Collection: “Live tweets” Mode
- Twitter Data Collection: New Query Creation Interface
- Twitter Data Collection: New Geo-based Search
- Twitter Data Collection: Additional Metadata Fields
- Twitter Data Analysis: New Network Discovery Interface
Netlytic gets a refresh for 2021. We have added lots of new researcher-friendly features including:
- an easier to use query-creation interface for Twitter data collection,
- a new log file to help users (Tier 3) to monitor data collection progress and adjust data collection criteria in real time,
- new Twitter data collection modes: “Recent tweets” and “Live tweets” modes.
- Ability to export a labelled dataset…
About: Netlytic is a cloud-based text and social networks analyzer that can automatically summarize textual data and discover communication networks from publicly accessible social media posts. It has been in use for over a decade by researchers to conduct research in the public interest and by educators and students from around the world to teach and learn about social media analytics.
New General Features
More Informative ‘My Datasets‘ Page
- In the top right corner of the My Datasets page, you can now see
- the server’s local date and time, which is in the Eastern time zone (all expiry dates for accounts and live data collections are set in accordance with this date/time), and
- your account’s email address, which is especially useful to know if you are managing and using multiple Netlytic accounts.

Updated Preview Page
- You can now review and search for relevant posts using keywords in the Preview step. (Use this to confirm that your data collection query is surfacing posts of the types you expect. If it’s not, consider modifying your search criterias.)

New Treemap Visualization
- Since most popular browsers no longer support Adobe Flash, we retired and replaced the Treemap visualization of “Dictionaries (Manual Categories)” under Text Analysis with an alternative chart using the Google Charts library. This new visualization should work in most browsers as long as you have JavaScript enabled.

Ability to Export a Labelled Dataset
- You can now export a labelled dataset based on the Dictionaries (Manual Categories) analysis (under Text Analysis)
When analyzing a dataset using content categories that you created under the Text Analysis step called “Dictionaries (Manual Categories)”, you can now export a labelled dataset as a CSV file, which will contain the original dataset + two additional columns: “category” and “terms” (see the screenshots below):
- For each post that was categorized under one of the dictionaries (“manual categories”), the “category” column in the CSV file will include the name of the relevant category.
- The “terms” column will list one or more relevant keywords or phrases found in the post that also correspond to the category listed in the “category” column.
- Both fields will be empty if a post does not include any relevant terms.
In the example below, the second post (third row in the table) has been classified under the “feelings (good)” category because it contains the word “nice”, which happened to be one of the dictionary words listed/entered in the “feelings (good)” category.
Read more about this feature here.


New Interface to Manage Dictionaries (Manual Categories)
- You can now access an easy-to-use interface for managing Dictionaries (Manual Categories) of words/phrases for Text Analysis

New Twitter-specific Improvements
New Twitter Data Collection Modes in Netlytic: “Recent tweets” and “Live tweets” modes.
In this update, we have made some improvements to Netlytic’s Twitter data collection interface and protocols, here is a quick review of two modes for Twitter data collection: (a) “recent tweets” and (b) “live tweets” modes.
Both modes use the same Twitter Search API. The main difference is how often this API is being queried and how many records are retrieved per API call. These differences are outlined below.
Twitter Data Collection: “Recent tweets” Mode
- “Recent Tweets” mode (Available in Tier 1,2 and 3 accounts)
This mode will attempt to retrieve recent tweets that fits your search parameters (posted within the past 7 days) up to the number of tweets permitted to be stored in your Netlytic account (2.5K tweets per dataset for a Tier 1 account; 10K tweets per dataset for a Tier 2 account; 100k per dataset tweets for a Tier 3 account).
For Tier 1 & 2 accounts:
Once the collection starts, you will see the following screen with two progress bars. The first bar on the left (“Overall progress”) shows the overall progress of data collection (in percentage) relative to the maximum number of records that can be stored in your Netlytic account. Once this progress bar reaches 100%, the collection will stop.
The second bar on the right (“Twitter API call limit …”) shows the percentage of API calls made under your account during the current collection session. Once this progress bar reaches 100%, the collection will pause until it is permitted to resume in accordance with Twitter’s rate limit. If it happens, Netlytic will display the number of seconds during which the collection is paused.
Important: In any case, if you have a Tier 1 or 2 account do not close the browser until the “Overall progress” bar reaches 100%. If you close the browser you will stop the collection.
Once the screen shows the number of saved/updated records, and you will be able to see the “Go Back” and “Next Step” buttons, this means that your collection is now done and you can safely proceed to the data analysis stage.

For Tier 3 accounts:
Because Tier 3 accounts permit collection of up to 100k recent tweets (posted within the past 7 days), the collection will automatically proceed in the background. You will see the following message confirming that the collection has been queued and that it is safe to close the browser or go to a different page.

During the collection process on the My Datasets page, you will see a note indicating that tweets are still being collected (as shown in the screenshot below). You can click on this message to see the progress.

If some tweets have already been collected, the Preview step of the dataset will display a searchable table with the collected records (see below). Important: It is safe to do a preliminary exploration and analysis of tweets that have already been collected, even if the collection is still ongoing. However, if you do any exploratory (text or network analysis) before data collection is complete, you will need to rerun them again once data collection is complete.

Twitter Data Collection: “Live tweets” Mode
- “Live Tweets” mode (Available in Tier 3 accounts only)
Because of the computing demands on the server, the Live Tweets mode is only available to Tier 3 accounts.
This mode will query Twitter every 15 min to collect up to 1000 recent tweets that fit your search parameters per dataset. (This mode is best suited for collection of ongoing discussions during live events.)
If you have a Tier 3 account and you want to collect data using the “Live Tweet” mode of data collection, click on the “Enable data collection …” checkbox when you are creating a new dataset and specify the time period for data collection (between 1 to 62 days) as shown below.

Important: When you start a new dataset using the “Live Tweets” mode of data collection, you will need to wait for the first search to complete. This initial “pull” will retrieve up to 1000 most recent tweets. This is a good time to confirm that your search query is not too narrow and that the parameters you have set for the data collection is able to find some relevant tweets. If it is not, consider refining/expanding your search parameters.
Once the screen shows the number of saved/updated records and the “Go Back” and “Next Step” buttons appear, it means that the initial “pull” is done and you can go to a different page. After this, the collection will continue to automatically run in the background by querying Twitter API every 15 minutes for the number of days that you have specified. You will receive an email once the live collection reaches the expiry date/time.

Please note that the live collection end date/time is based on when you started the collection. For example, if you started collecting tweets today at 3:14pm and set the collection to continue for 1 day, the end date/time for your collection will be next day at around 3:14pm. To confirm the end date/time, simply mouse over the live collection icon next to the dataset under the My Datasets page (see below).

- If you are running a live data collection, you can now stop it at any time using the Stop Collection button under the Edit page of a selected dataset:

- For live collections, you can also see the latest log message from the collector about the number of tweets that have been retrieved during the most recent call to Twitter API. This detailed message is available in the Preview step of a selected dataset.

Note on how to interpret the log text:
- Since Netlytic queries Twitter API every 15 minutes to look for new tweets, the number of “skipped duplicates” listed at the end of the log message can give you an idea if your search query is too broad or too specific. If you are consistently seeing that Netlytic skips a few duplicates, it is a sign that your collection is likely capturing all/most of the relevant tweets. On the other hand, if the number of skipped posts is consistently 0, it suggests that your search query returns more tweets than Netlytic can capture within the 15 min window.
- By itself, it’s not an issue if you are only interested in collecting a sample of tweets that correspond to your search criteria. Otherwise, to capture more relevant tweets per 15 min, consider splitting your broad query into multiple more specific ones to run as separate live collections in parallel.
- Another number to pay attention to is the total number of tweets returned in responses to your search query. If the log shows it as 0, it is usually a sign that your search is too narrow and that you need to update your search criteria. If this happens, just go to the Edit step of a select dataset, modify your search query, and click the Update button to relaunch the query.
- Also keep an eye on the message stating “The script reached the API limit”. This usually happens if you are running too many live collections at the same time. If you see this message, check the log again in 15 minutes and 30 minutes. If the message is still there, you might need to reduce the number of live data collections. We recommend having no more than 10-15 simultaneous live collections.
- “Fun” API fact: The way to calculate how many live collections you can run is to consider that each user can send 180 calls to Twitter API every 15 minutes, and each call can return up to 100 tweets. So, for Netlytic to collect up to 1000 tweets per 15 min, it needs to make at least 10 calls to Twitter API. The absolute maximum number of simultaneous live collection is 18.
Twitter Data Collection: New Query Creation Interface
- Regardless of whether you are creating a new collection in the “Live” or “Recent Tweets” mode, you can now use a new interface for creating a search query for Twitter data collection (see the screenshot below). This new interface makes it easier to create complex search queries using Twitter-supported advanced search operators.

Tip: Once you enter your search keywords and select additional filters, we highly recommend testing your query using Twitter’s web interface before starting a new collection. You can do it using the “Test Query on Twitter” button provided at the end of the search form. Once clicked, it will launch a new search directly on Twitter and will appear in a new tab of your browser.
Examine Twitter search results in this new tab to see if your search query returns at least some tweets posted within the last 7 days. This is because Twitter’s search API used by Netlytic to collect public tweets can not collect historical tweets, ie… tweets older than 7 days.
If you are satisfied with the search results as displayed on Twitter, return to Netlytic and click the Import button at the end of the page to start your data collection.
Twitter Data Collection: New Geo-based Search
- Netlytic also makes it easier to restrict your collection to only tweets from users located within the given radius of a given location. This is useful to track breaking news or live events and incidents occurring in real time. In Netlytic, the location-based filter is labelled as #3 in Netlytic’s new Twitter data collection form for Twitter data:

To use the location-based filter, you will need to provide four parameters:
- starting with the coordinates of a specific location in the form of two decimal numbers: latitude – a number between -90.0 and +90.0 (North is positive); longitude – a number between -180.0 and +180.0 inclusive (East is positive);
- distance from the specified location which will be used as a radius, and
- whether to measure this distance in kilometers (km) or miles.
Hint: An easy way to identify the latitude & longitude of a desired location is to use Google Maps. Here is how:
- In a new tab of your browser, go to Google Maps.
- Search for the desired location. For example, let’s search for Times Square
- Select the most central point on the map and right-click to see the context menu as shown on the screenshot below.
- The two decimal numbers listed at the beginning of the context menu are the latitude & longitude of the selected location that you will need to save to enter later when creating a new dataset in Netlytic.
- To copy these two numbers into your clipboard, simply click on them, and Google Maps will save them for you into the clipboard for later use.

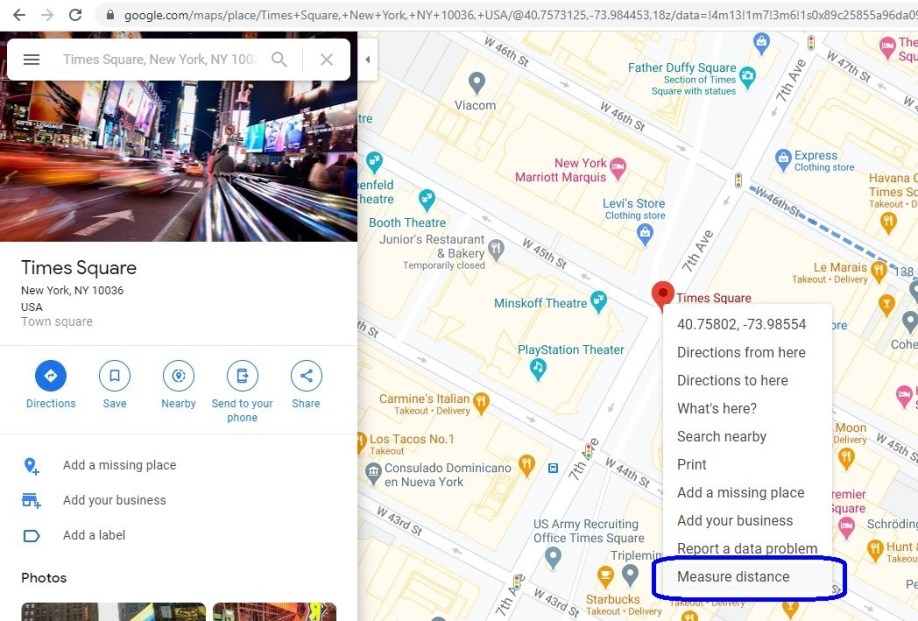
- Next, you’ll need to decide on the radius from this location to collect tweets from. To do this, right click on the same location again in Google Maps to see the context menu. After this, click on the “Measure distance” option as shown below.
- This option will allow you to drag and drop a line from the original point on the map as far as you intend to collect tweets from. In the case of our previous example, 2km would cover the area from Times Square to Hudson River, and from Times Square to Hudson River on the other side of Manhattan island. Important: To cover the whole island of Manhattan, you will have to create multiple datasets with different central points.

Twitter Data Collection: Additional Metadata Fields
- Netlytic now collects additional metadata fields from Twitter API. Below is the list of all metadata fields; the newly added fields are bolded in blue.
| Field | Definition (as per Twitter API) |
|---|---|
| tweetid | Unique identifier for the tweet |
| guid | Link to the tweet |
| link | Link to the tweet |
| author | Username of the account that posted the tweet |
| title | Tweet content, truncated to 140 characters (starts a username(s) if it’s a reply or “RT @username” if it’s a retweet) |
| description | Full tweet |
| pubdate | Date and time when the tweet was posted |
| source | Twitter client used to post the tweet |
| favorite_count | Number of times the tweet was liked at the time of its collection |
| retweet_count | Number of times the tweet was retweeted at the time of its collection |
| lang | Language of the tweet, as determined by Twitter |
| user_mentions | List of usernames mentioned in the tweet |
| quoted_text | If the tweet is a quote, this field contains the content of the quoted tweet (if applicable) |
| tweet_type | tweet type (original tweet, reply, retweet, quote) |
| in_reply_to_screen_name | If the tweet is a reply, username of the original poster this tweet is replying to |
| in_reply_to_user_id | If the tweet is a reply, user id of the original poster this tweet is replying to |
| in_reply_to_status_id | If the tweet is a reply, tweet id of the original tweet this tweet is replying to |
| retweeted_screen_name | If the tweet is a retweet, username of the original poster |
| retweeted_user_id | If the tweet is a retweet, user id of the original poster |
| retweeted_status_id | If the tweet is a retweet, tweet id of the original tweet |
| user_id | Unique identifier for the user who posted this tweet |
| profile_image_url | Link to the profile image of the poster |
| user_statuses_count | The total number of tweets shared by the poster |
| user_friends_count | The total number of accounts followed by the poster |
| user_followers_count | The total number of accounts that follow the poster |
| user_created_at | The date/time when the poster joined Twitter |
| user_bio | A bio description as provided by the poster in their Twitter profile |
| user_location | Location description as provided by the poster in their Twitter profile |
| user_verified | Whether the poster is a verified user, as approved by Twitter |
Twitter Data Analysis: New Network Discovery Interface
- Finally, for new Twitter datasets, we’ve simplified the network discovery interface. It now gives you four distinct options to connect users found in your datasets as shown in the screenshot below.
