Dataset Type: a CSV file containing messages from Twitter
Step 1: Download the CCK11 dataset to your computer
LASI_CCK_11_Twitter – sample.csv
Sample dataset
Notes:
- This dataset contains a sample of public tweets posted by participants in a Massive Open Online Course called CCK11.
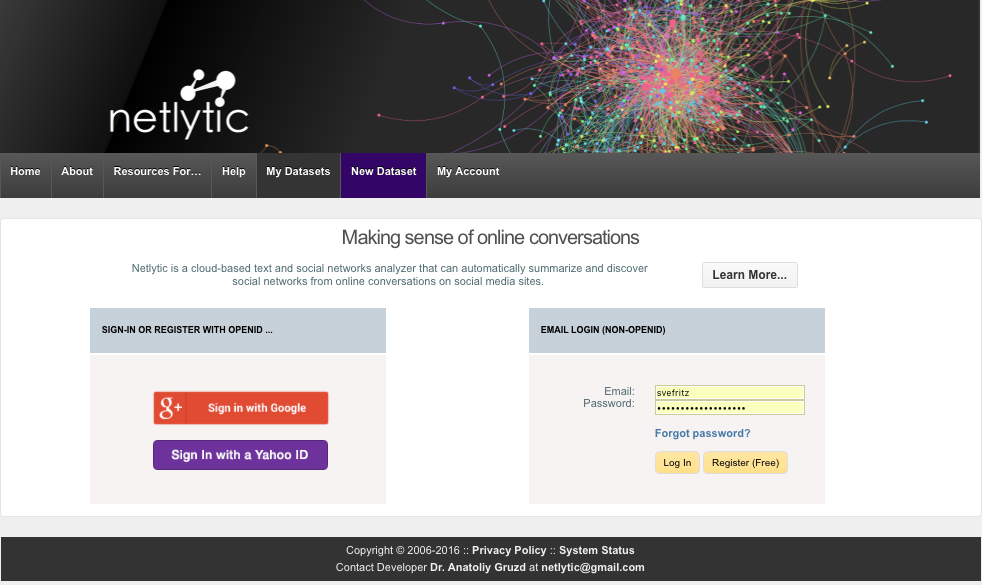
Step 2: Login to with your Google or Yahoo ID
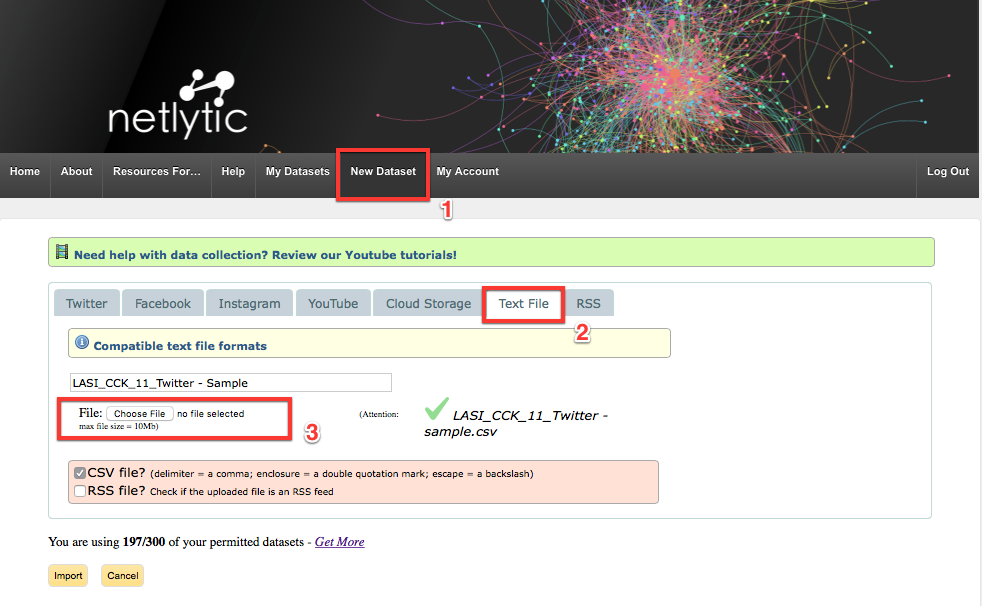
Step 3: Import the sample dataset from Step 1 as ‘Text File’. First click add new dataset, select the Text file tab and then upload the file to Netlyic. Don’t forget to give your dataset a name.
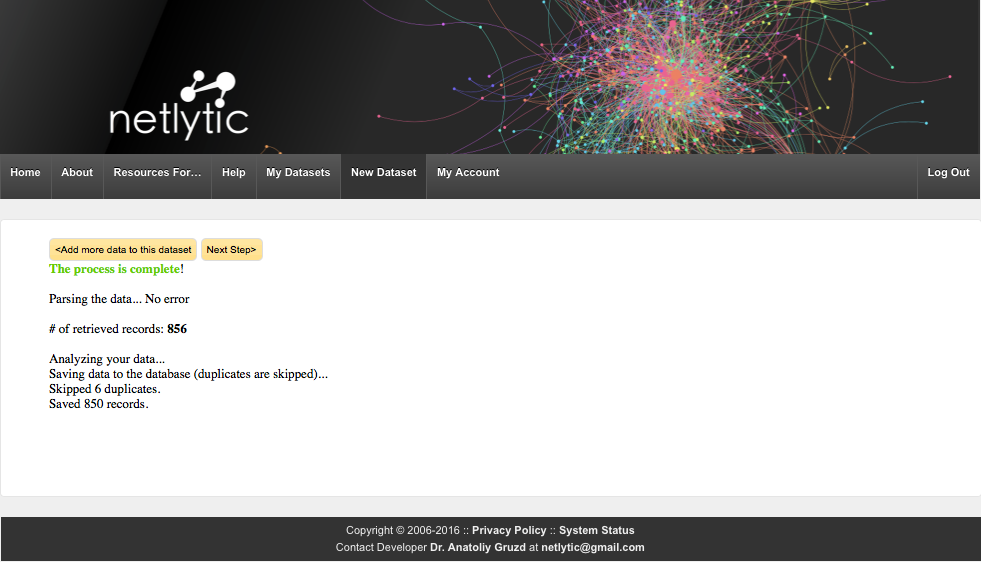
The next screen will show you whether the dataset has been imported properly.
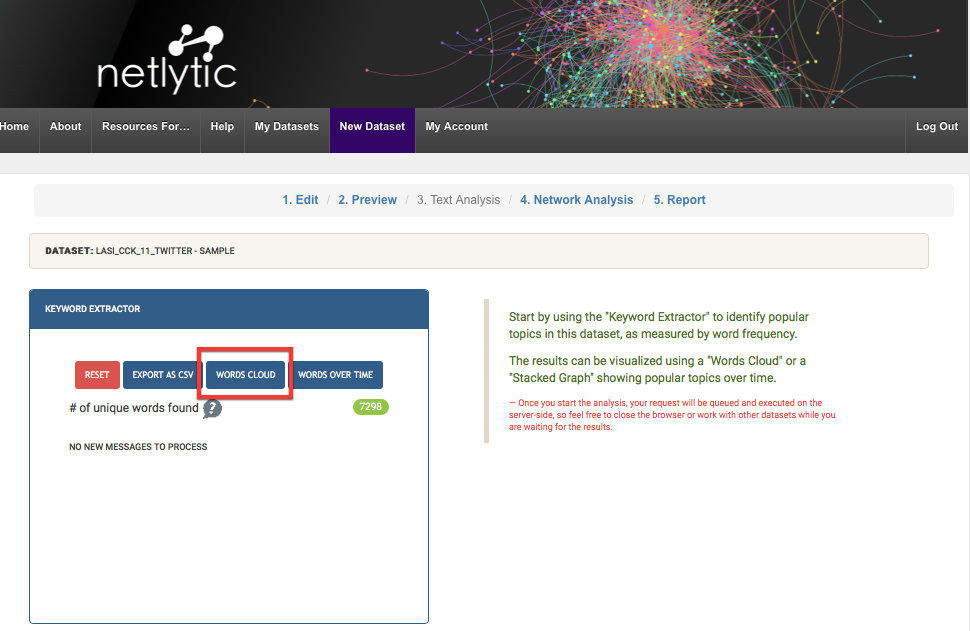
Step 4: Click “Next Step” and go to the “Text Analysis” tab, then click “Analyze” under “Keyword Extractor”
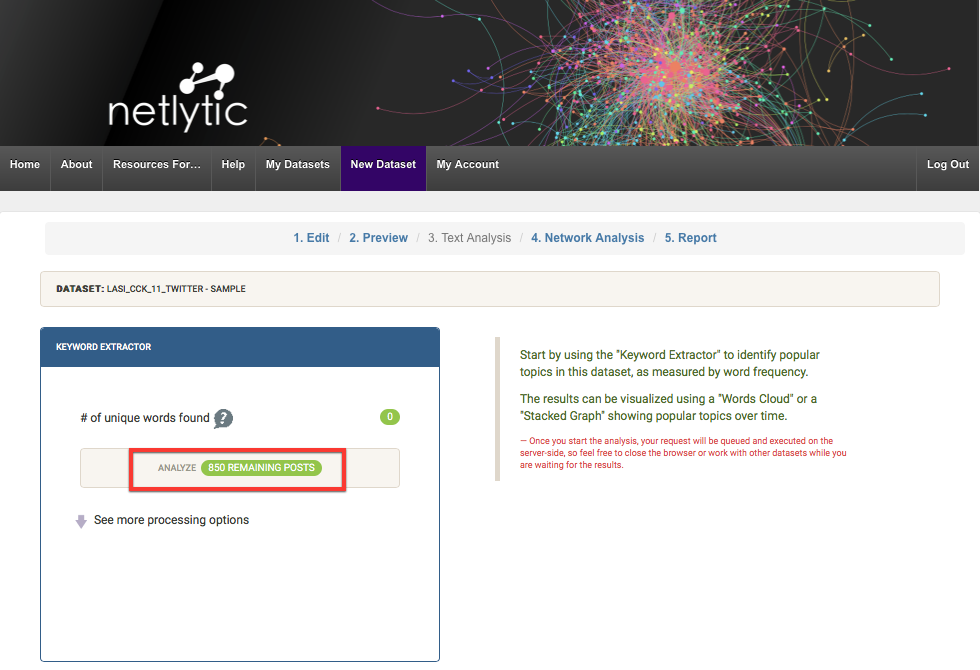
Step 5. Click on “# Remaining Posts” to analyze the data. Once all records have been processed, click on the “Words Cloud” button. A separate pop-up window will show a tag cloud of frequently used words.
NOTE: For more details on how to use this feature, see the online help page at

Step 6. Click the red color X-button to the right of the “cck11” tag to remove it (since it is a common hashtag and would be consider a noise word for the purpose of this analysis).

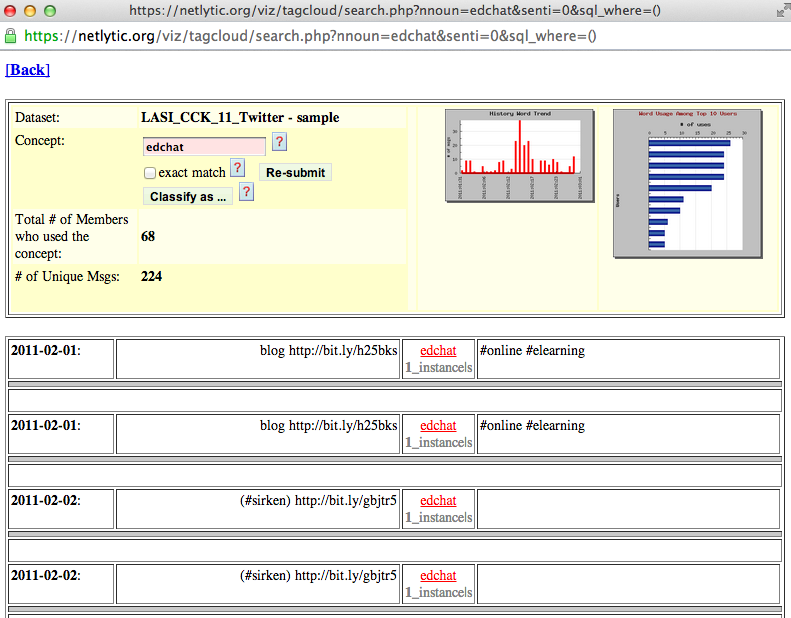
Step 7. Click on any of the remaining words in the word cloud to examine the exact instance(s) where these words appeared in your dataset. (To get more context as to why a particular word was used so frequently, click and examine words that might be surprising or unfamiliar to you.)
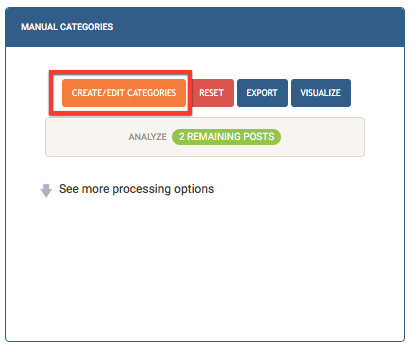
Step 8. Scroll down to the “Dictionaries/ Manual Categories” section and click the green “# Remaining Posts” button to analyze the dataset.
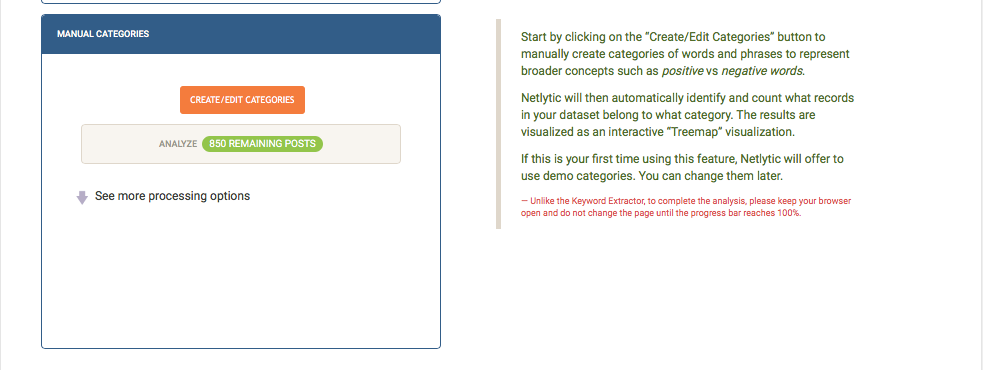
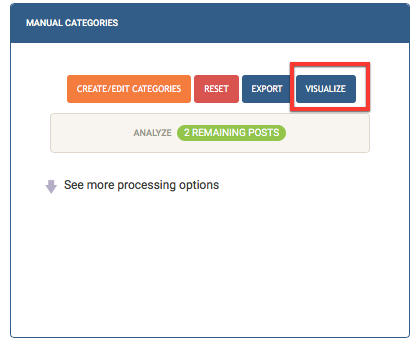
Step 9. Once the analysis is complete, click on the “Visualize” button under the Categories section to explore the resulting clusters.


Step 10. Close the pop-up window. Next, in order to create your own categories designed specifically for studying collaborative learning, go back to the “3. Text Analysis” tab and click on the “Create/Edit Dictionaries” button in the “Dictionaties/Manual Categories” section
NOTE: For more details on how to create your own categories, see the online help page at /?page_id=11101
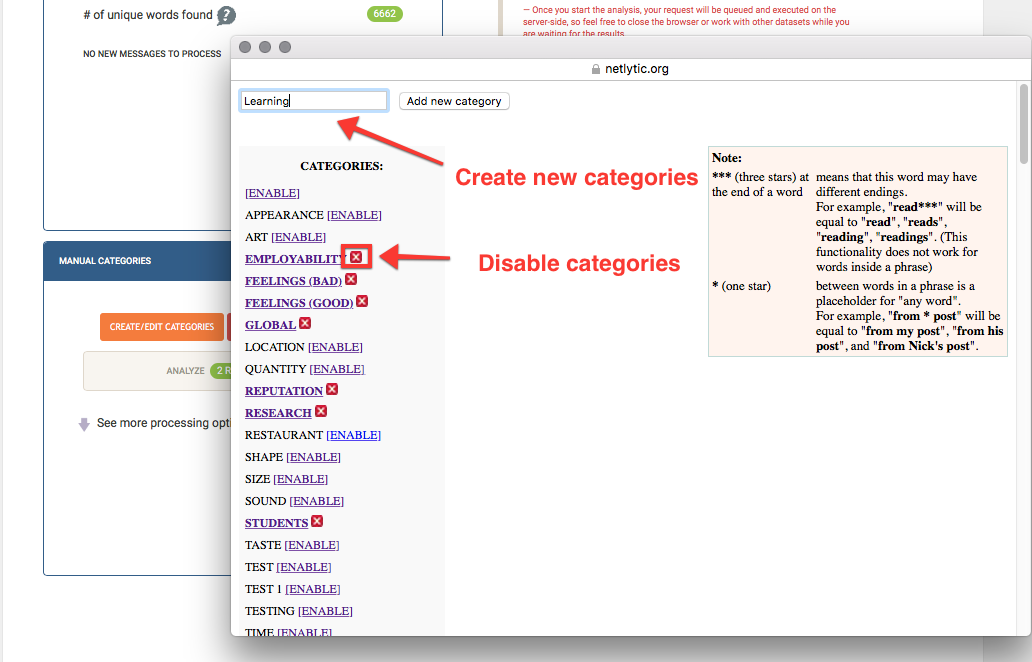
Step 11. In the pop-up screen, disable (delete) the demo categories and create the following categories in Netlytic. Discuss what keywords/phases did you include in each category and why.
- Learning
- Connecting
- Innovation
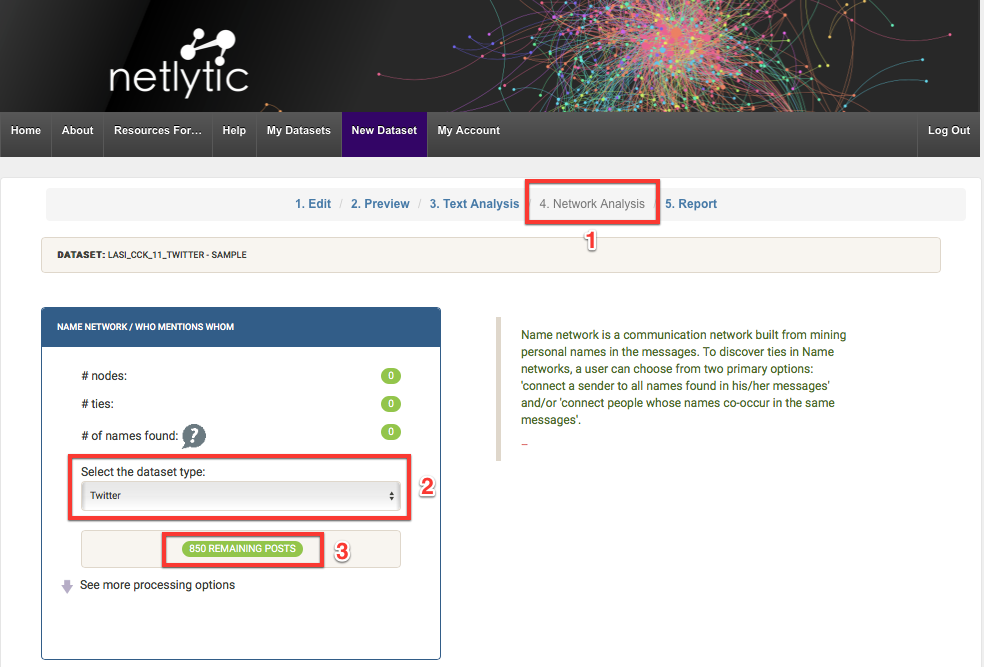
Step 12. Go to the “4. Network Analysis” tab, find the “Name Network” section and select the dataset type as “Twitter” from the drop down menu, then click the “# Remaining Posts” button to analyze the dataset.
Step 13. Once the network is built, click on the “Visualize” button
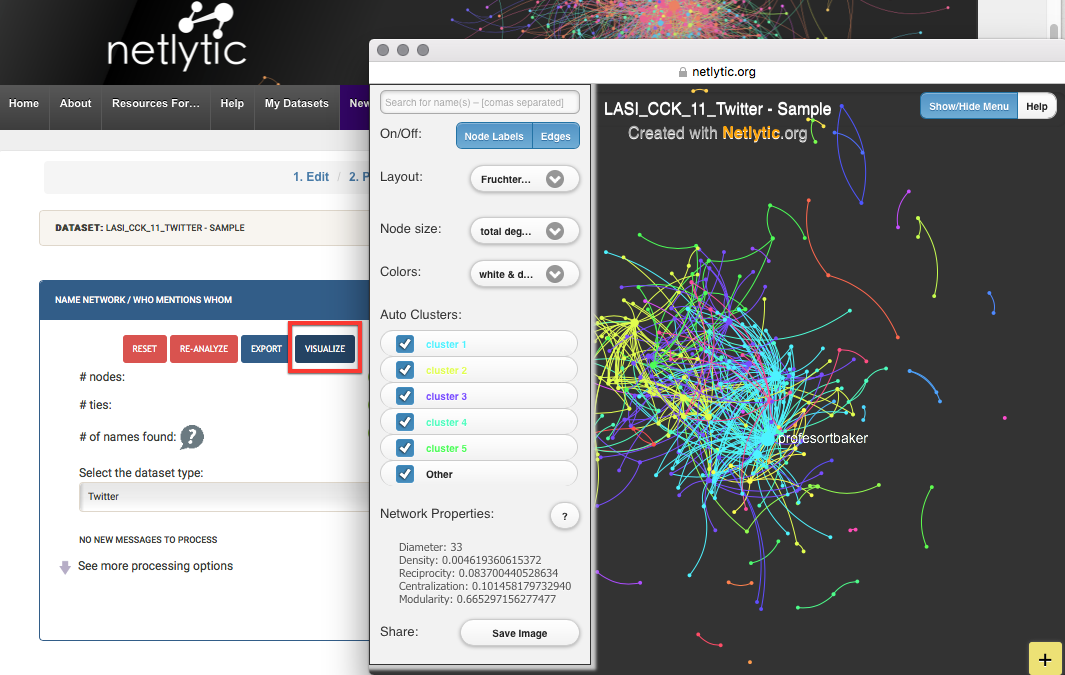
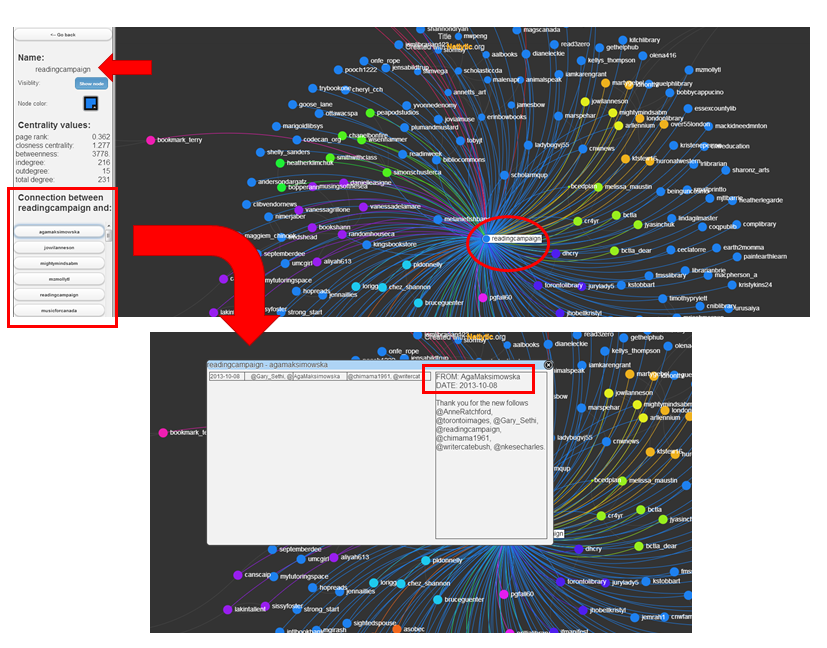
Step 14. Review some of the most connected members of the class, as indicated by the larger node size, and then read some of the messages exchanged among the class participants to understand the formation of connections among the students.
To access individual tweets, click on the node/person in question and then click on any of the connecting nodes/names listed in the left pane.
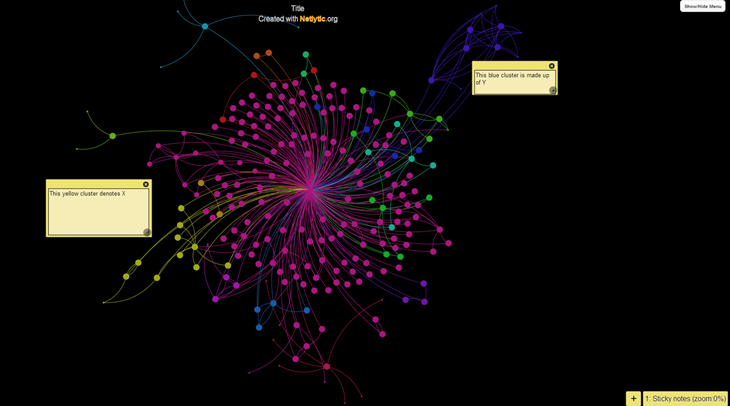
Step 15. Annotate 3-5 areas and/or clusters in the network by using the Notes feature.
To label and annotate information about the various cluster and individual in the network visualization, use of the yellow “Sticky Notes” feature. To activate this feature, click the yellow box containing a plus sign located in the bottom right hand corner of the network visualization window. This feature allows you, the researcher, to label and annotate information about the network.
As you add sticky notes to the network visualization, they will appear at the bottom lower right hand corner of the network visualization screen along with information about the zoom level associated with each note.(e.g. 0%, 25%, 50%, etc.)
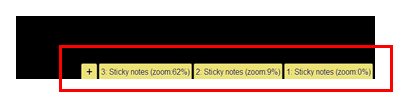
To capture a snapshot of your network and any sticky notes about your network, click on the “Save Image” button in the left pane. You can only save and publicly share up to three snapshots at a time in the system. If you want to take and save additional snapshots of your network, you will need to save them to your computer first and delete them from the system to make room for new snapshots of your network. For example you might want to take additional snapshots because you want to show/document something interesting about the interactions of a particular clusters of students from your class.